myninka
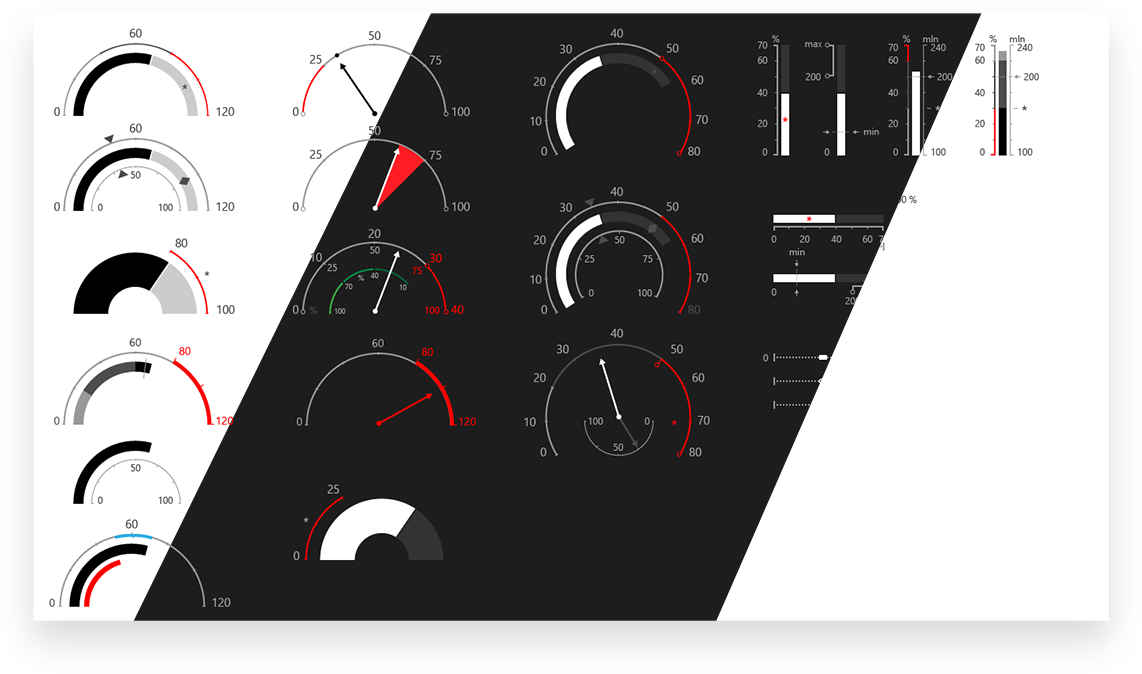
Data Visualization
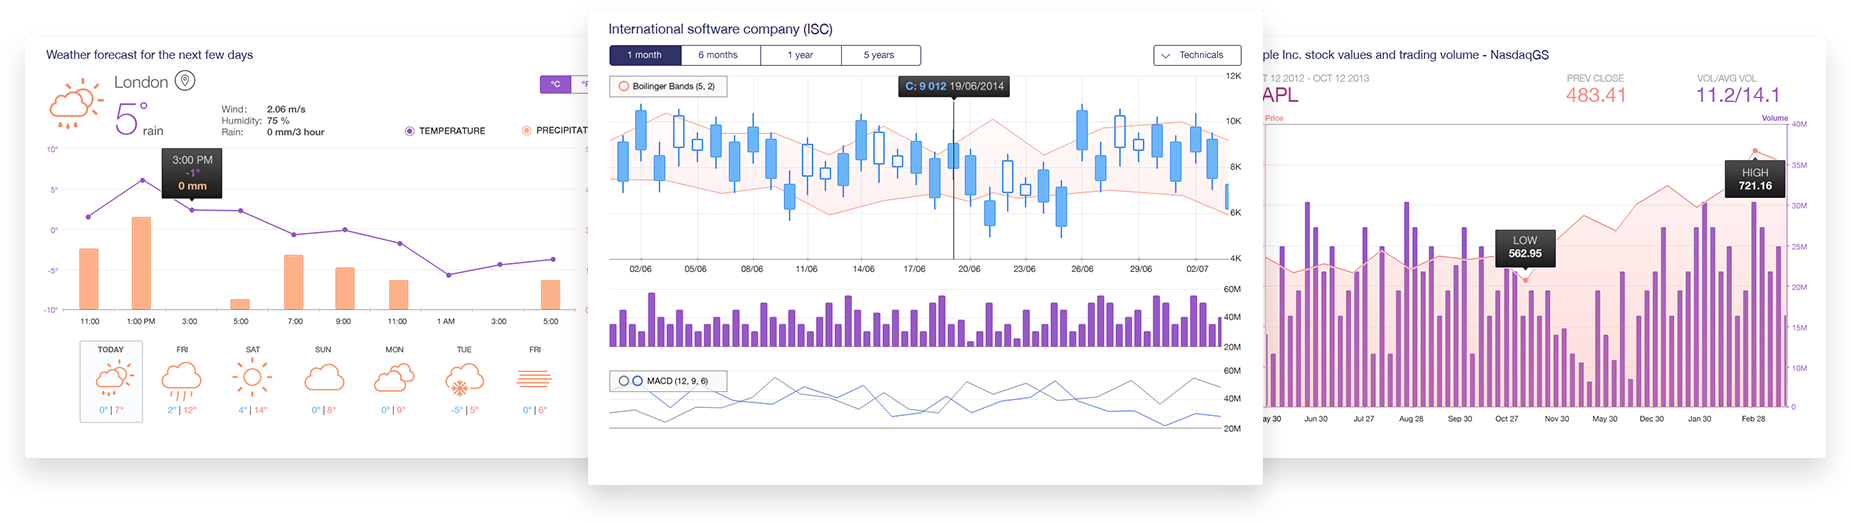
Demos showing different chart types
for Telerik UI for iOS tablet app.
My task here was to design data viz components - charts and gauges. I created the interaction and user interface design of the components and used them in real-life scenarios (demos) depicted here. The demos had to represent the most common use of the components which I identified in the research phase.
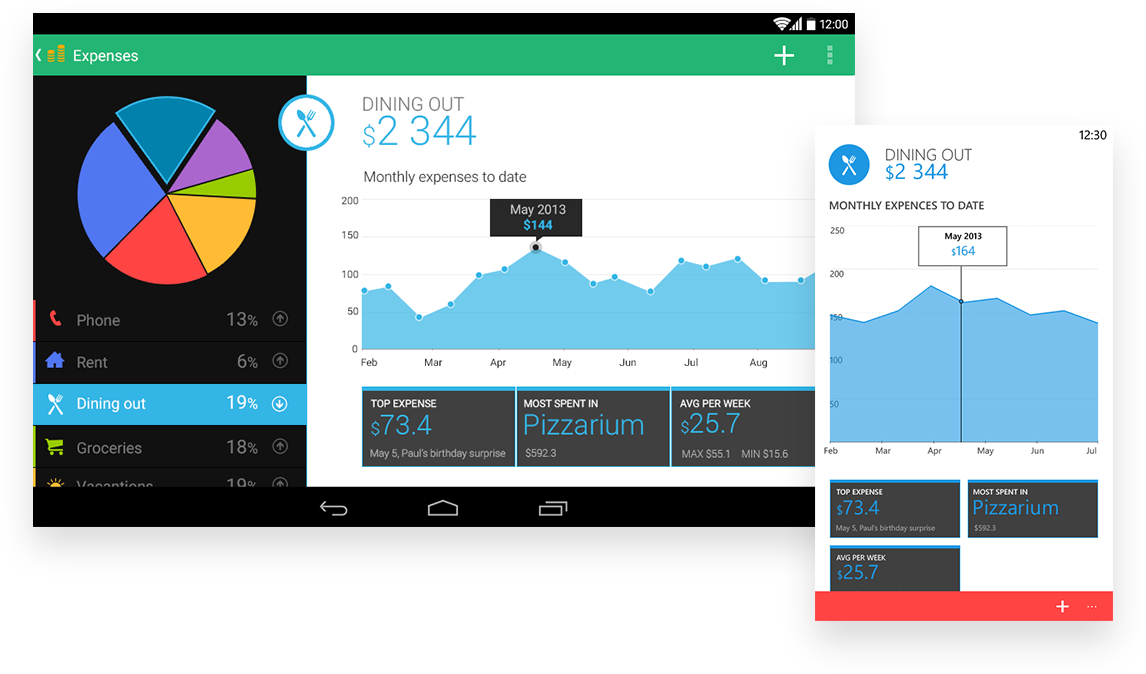
Sample mobile dashboards
for Telerik UI for Android and Telerik UI for UWP
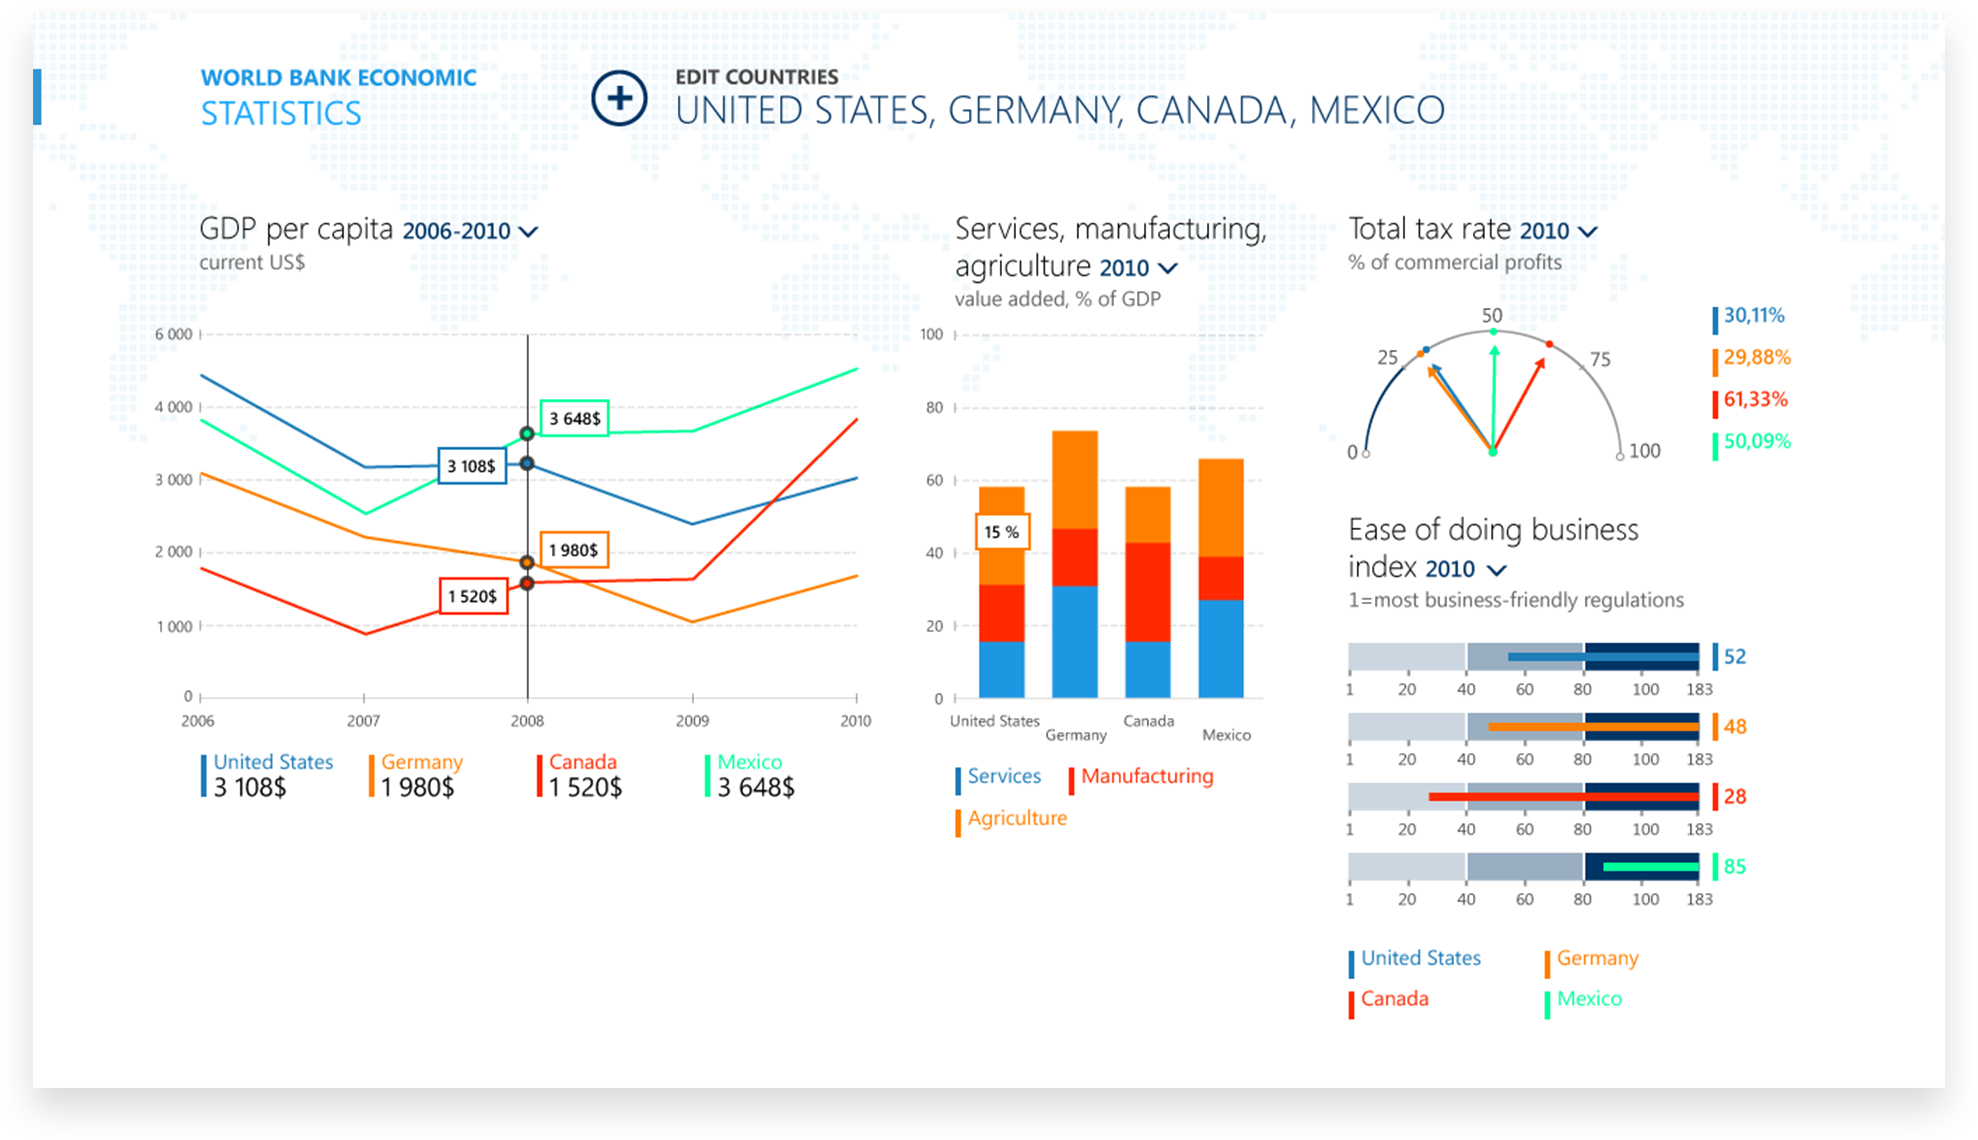
Sample desktop app
for Telerik UI for Windows Universal